

Feature
Exam Analytics
See exactly what happened after every mock exam.
Last updated: August 17, 2026
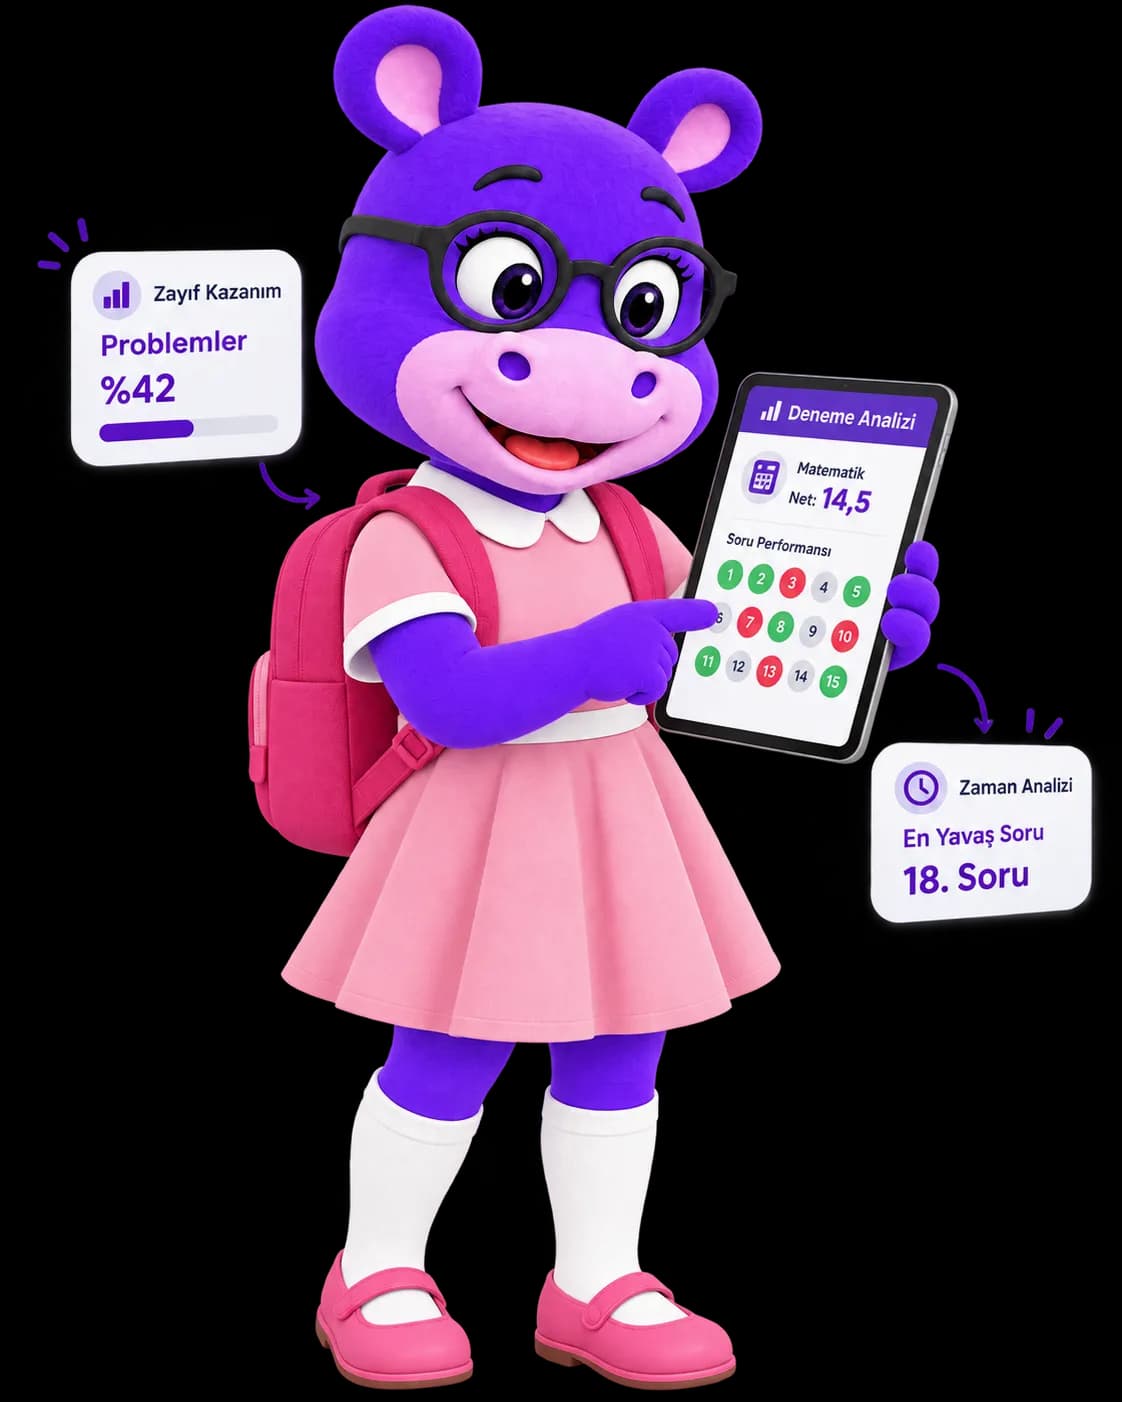
After every exam, the platform breaks down performance by question-level timing, learning-outcome mastery, and cognitive level (knowledge, comprehension, application, analysis), while also flagging whether accuracy drops as the student speeds up and surfacing patterns across exams. The exam timer itself is tracked server-side rather than in the browser, so it cannot be tampered with from the client. Comparisons are only ever made among students who sat the exact same question set in the same sitting, keeping any class average honest and statistically meaningful. Results can be downloaded as a server-generated PDF report card, and every exam is archived automatically for historical comparison.
Live preview
Pick a sample mock exam, analyse it, and watch the weakest learning outcome turn into a weekly plan. The net-score formula, mastery percentages, and colour thresholds match the real product.
My exams
Step 1/4 · Pick an exam
Start with a ready-made sample exam.
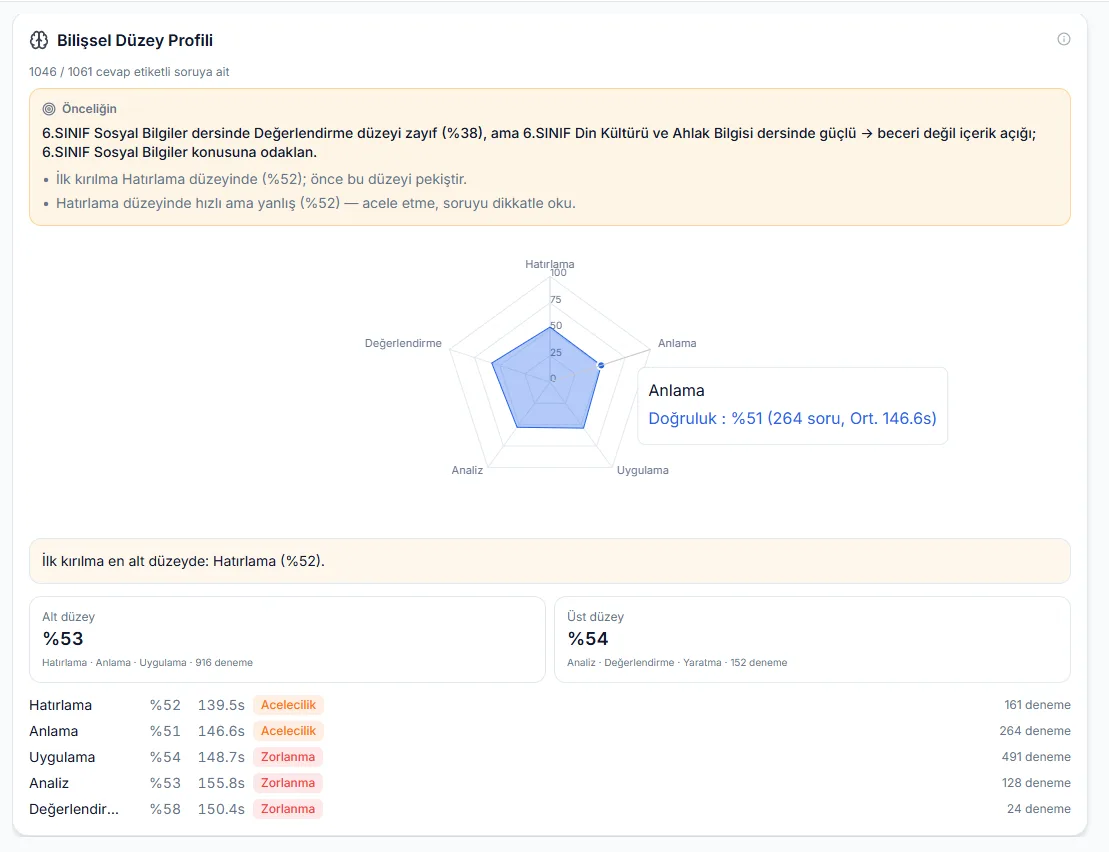
In the real product: per-question time analysis, five anomaly types, cohort comparison with students who took the exact same paper, and a server-generated PDF report card.
How it works
Server-side timer tracking
The exam timer lives on the server, not the student's browser: the system tracks accumulated active time, the last resume time, and the last heartbeat signal, auto-pausing if the student goes idle or disconnects. Scheduled exams can also enforce an optional open/close time window server-side.
Question-level behavior analysis
Time spent and accuracy are recorded for every question, letting the system surface the tempo-accuracy relationship, whether accuracy drops as the student speeds up.
Anomaly detection
Five distinct anomaly types are flagged automatically from exam-taking behavior: slow outliers, fast outliers (rushed wrong guesses), heavy revisits (indecision), focus loss (switching away from the tab), and blank answers left after long deliberation (a genuine knowledge-gap signal).
Fair, cohort-based comparison
Cross-exam comparison relies on a cohort key calculated from the exact question set and sitting date; only students who took the identical exam paper are ever statistically compared, and a student's own self-generated practice exams are never compared against other people's results.
PDF report card and auto-archive
Results are turned into a downloadable server-generated PDF report card; every exam is archived automatically, so historical comparison is always available.
Time analysis screen
After the exam a separate time analysis opens: average and median time per question, your pace percentile among everyone who took the same exam, and the single question that slowed you down most — all on one screen.
Class time profile
The teacher sees the whole cohort that took the same exam in one table: total active time and average per question for each student, next to the class median. Who ran out of time and who rushed is readable straight from the list.
What it offers each role
Student
Sees their own question-level timing, learning-outcome, and cognitive-level breakdown for every exam, reviews flagged anomalies, and downloads a server-generated PDF report card.
Teacher
Sees class-level and cohort-level comparisons across students who sat the same exam paper, and spots which students show tempo-accuracy issues or knowledge-gap signals such as blank answers left after long deliberation.
Parent
Can track their child's exam results, question-level performance, and PDF report card, following progress by comparing across past exams.
- Question-level timing and learning-outcome breakdown are generated automatically after every exam.
- Performance is reported by cognitive level (knowledge, comprehension, application, analysis).
- The exam timer is tracked server-side, not on the student's device, so it cannot be manipulated from the browser.
- The system names and detects 5 distinct anomaly types: slow outliers, fast outliers (rushed wrong guesses), heavy revisits (indecision), focus loss (switching away from the tab), and blank answers left after long deliberation.
- The blank-after-deliberation signal points to a genuine knowledge gap rather than laziness or running out of time.
- Whether accuracy drops as the student speeds up (the tempo-accuracy trade-off) is reported for every exam.
- Cross-exam comparison only happens among students who took the exact identical exam paper in the same sitting.
- A student's own self-generated practice exams are never compared against other people's results.
- Results become a downloadable, server-generated PDF report card.
- Every exam is archived automatically, so historical comparison is always available.
- Pace percentile and slowest question are listed on a dedicated time analysis screen after the exam.
- Class time profile for teachers: every student's timing on the same exam, compared against the class median.
Frequently asked questions
After every exam, the platform generates question-level timing and accuracy, a learning-outcome breakdown, and performance by cognitive level (knowledge, comprehension, application, analysis). It also reports whether accuracy drops as the student speeds up, and patterns across exams.
The system automatically flags 5 distinct types of anomalies from exam-taking behavior: slow outliers, fast outliers (rushed wrong guesses), heavy revisits (indecision), focus loss (switching away from the tab), and blank answers left after long deliberation. These signals rely on statistical comparisons and behavioral thresholds; for example, blank after deliberation points to a genuine knowledge gap.
Time is tracked on the server, not in the student's browser: the system monitors accumulated active time, the last resume time, and the last heartbeat signal, auto-pausing the timer if the student goes idle or disconnects. This means the timer cannot be tampered with from the browser. Scheduled exams can also enforce an optional open/close window server-side.
Comparison relies on a cohort key calculated from the exact question set and sitting date; only students who took the identical exam paper are ever statistically compared. A student's own self-generated practice exams are not compared against other people's results, since that comparison would not be statistically meaningful.
Yes, results can be turned into a server-generated PDF report card and downloaded.
Yes, every exam is archived automatically, so historical comparison is always possible and patterns across exams are reported.
Average and median time per question, your pace percentile, the question that slowed you down most, and the anomalies flagged from your exam behaviour. On the teacher side the same data is aggregated at class level: each student's total active time and per-question average listed next to the class median.
Related features